United States life tables, 1910 / prepared under the supervision of Prof. James W. Glover, of the University of Michigan.
- United States. Bureau of the Census.
- Date:
- 1916
Licence: Public Domain Mark
Credit: United States life tables, 1910 / prepared under the supervision of Prof. James W. Glover, of the University of Michigan. Source: Wellcome Collection.
32/80 (page 26)
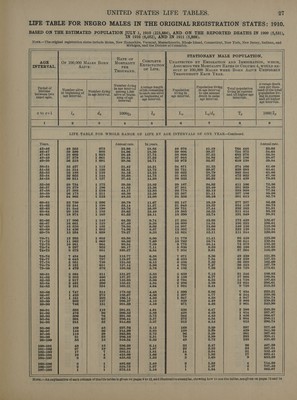
![LIFE TABLE FOR NEGRO MALES IN THE ORIGINAL REGISTRATION STATES: 1910. BASED ON THE ESTIMATED POPULATION JULY 1, 1910 (223,884), AND ON THE REPORTED DEATHS IN 1909 (5,531), IN 1910 (6,052), AND IN 1911 (5,888). Note.—The original registration states include Maine, New Hampshire, Vermont, Massachusetts, Rhode Island, Connecticut, New York, New Jersey, Indiana, and _ Michigan, and the District of Columbia. STATIONARY MALE POPULATION, RATE OF AGE Or 100,000 Mates Born | Morratiry Sil in UNAFFECTED BY EMIGRATION AND IMMIGRATION, WHICH, INTERVAL. ALIVE: PER XPECTATION AssUMING THE Mortatity RatsEs IN COLUMN 4, WOULD RE- THOUSAND. or Lire. SULT IF 100,000 MALES WERE Born ALIVE UNIFORMLY THroucHouT Eaco YEAR. « Average death Number dying | 4 verage length Population livin fae ene Period of in age interva é : ; : 8| Total population lifetime yee ace Number dying} among 1,000 of life remaining Population in age interval higin cca hae sand of the total A : : to each one alive living in to one annual A opulation liv- between two in age interval.| alive at begin- Aeon = A and all higher age | 2OPU exact ages. age interval. ning of ane at beginning of age interval. death in same 8 ing in current i intervals ; ; age interval. age interval. ~ c and all higher segs oa age intervals. xtoz+1 1000qz Lz Lyz/dy Ty _1000/éz 1 3 4 6 7 8 9 INFANT MORTALITY—FIRST YEAR OF LIFE BY AGE INTERVALS OF ONE MONTH. Monthly rate. In years. Annual rate. 73.70 34.05 29.37 36.68 27.26 37.39 26.75 38.08 26.26 38.74 25.81 39.36 25.41 39.94 25.04 40.48 24.70 12.69 40.97 24.41 11.62 41.41 24.15 10.75 41.81 23.92 10.16 42.18 23.71 856 765 683 608 539 fst fk fk ok fond fot fost fut 0 AAARAGD Aededejeje] COGIC CD CIGD CHC Co Ca Co Co LIFE TABLE FOR WHOLE RANGE OF LIFE BY AGE INTERVALS OF ONE YEAR. Annual rate. In years. ; Annual rate. 21 935 34.05 29.37 5 42.53 2 44.55 1 45.01 44.78 44,25 43.62 42.94 42.20 41.44 40.65 39.85 39.05 38.27 37.51 36.77 36.05 35.37 34.71 34.08 33.46 32.86 32.26 31.67 31.06 30.44 29.81 29.18 28.55 27.94 27.33 26.74 26.16 25.58 25.00 24.42 23.84 = Thad B aie 1 ~~ —] pak fs fk fk fs fo fk ok fk kk fk fk Pk fk kt NORODOEOND «POPOROHOND BOROROROGD cDErEDENES](https://iiif.wellcomecollection.org/image/b32182685_0032.jp2/full/800%2C/0/default.jpg)